Anomaly Detection - Class Review
Last updated on:4 years ago
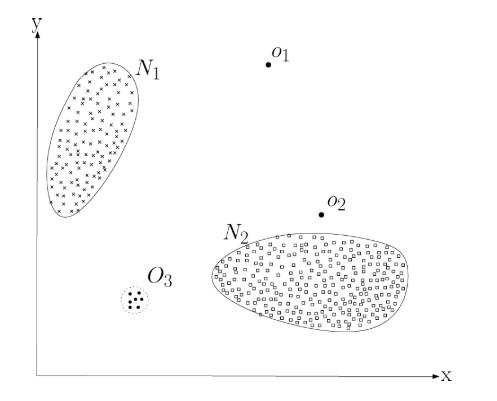
Anomaly detection refers to the problem of finding patterns in data that do not conform to expected behaviour. It can be utilized in fraud detection, medical and public health anomaly detection, industrial damage detection, image processing, etc.

Fraud detection
$x^{(i)}$ = features of user $i$ ‘s activities
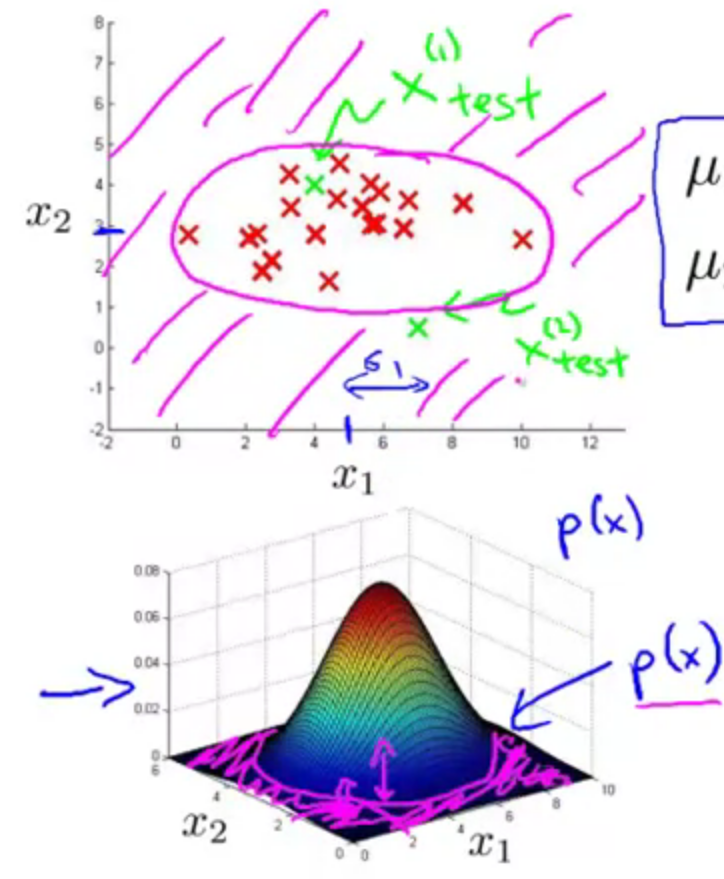
Model $p(x)$ from data
Identify unusual users by checking which have $p(x)<\varepsilon$
Anomaly detection algorithm
- Choose features $x_i$ that you think might be indicative of anomalous examples
- Fit parameters $\mu_j, \sigma_j^2$, Vectorize: $\mu = \frac{1}{m}\sum^m_{i=1} x^{(i)}$
- Given new example $x$, compute $p(x)$, anomaly if $p(x)<\epsilon$

Developing an evaluating an anomaly detection system
The importance of real-number evaluation, when developing a learning algorithm (choosing features, etc.), making decisions is much easier if we have a way of evaluating our learning algorithm.
Assume we have some labelled data, of anomalous and non-anomalous examples.
Algorithm evaluation
Fit model p(x) on the training set
on a cross validation/test example x, predict y
Possible evaluation metrics
Can also use cross validation $\epsilon$
Anomaly detection vs supervised learning
If it is a large volume of bad examples, you can shift over to supervised learning.
Anomaly detection
Fraud detection + manufacturing + monitoring machines in a data centre
Supervised learning
Email spam classification + weather prediction + cancer classification
| Anomaly detection | Supervised learning |
|---|---|
| Very small number of positive examples ($y = 1$). (0 - 20 is common) | Large number of positive and negative examples. |
| Large number of negative ($y = 0$) examples. | |
| Many different “types” of anomalies. Hard for any algorithm to learn from positive examples what the anomalies look like; future anomalies may look nothing like any of the anomalous examples we’ve seen so far. | Enough positive examples for algorithm to get a sense of what positive examples likely to be similar to ones in training set. |
Density estimation
$$p(x) = p(x_1;\mu_1, \sigma_1^2)p(x_2;\mu_2, \sigma_2^2) … p(x_n;\mu_n, \sigma_n^2)$$
$$= \Pi^n_{j=1}p(x_j;\mu_j, \sigma_j^2)$$
$$x_1 ~ N(\mu_1, \sigma_1^2)$$
$$x_2 ~ N(\mu_2, \sigma_2^2)$$
$$x_n ~ N(\mu_n, \sigma_n^2)$$
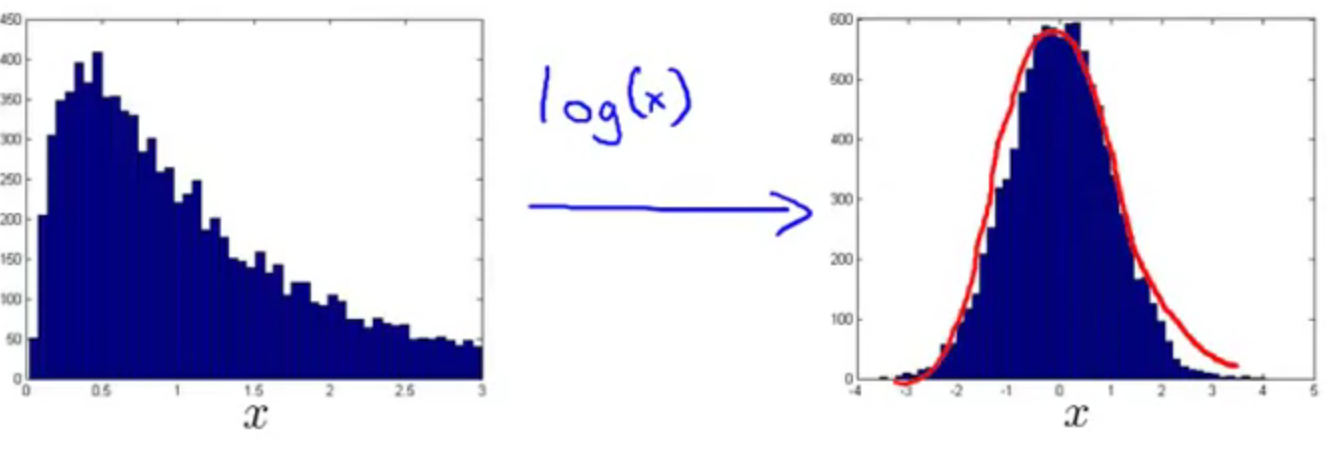
Choose what features to use
$$log(x_j + constant) \to x_j$$
$$\sqrt{x_j} \to x_j$$

Class exercises
Within classes
Q1: Suppose your anomaly detection algorithm is performing poorly and outputs a large value of $p(x)$ for many normal examples and for many anomalous examples in your cross validation dataset. Which of the following changes to your algorithm is most likely to help?
- [ ] Try using fewer features.
- [x] Try coming up with more features to distinguish between the normal and the anomalous examples.
- [ ] Get a larger training set (of normal examples) with which to fit $p(x)$.
- [ ] Try changing $\varepsilon$.
Homework
Q1: For which of the following problems would anomaly detection be a suitable algorithm?
From a large set of hospital patient records, predict which patients have a particular disease (say, the flu}.
- [x] In a computer chip fabrication plant, identify microchips that might be defective.
- [ ] Given data from credit card transactions, classify each transaction according to type of purchase [for example: food, transportation, clothing}.
- [x] From a large set of primary care patient records, identify individuals who might have unusual health conditions.
- [ ] Given an image of a face, determine whether or not it is the face of a particular famous individual.
This problem is more suited to traditional supervised learning, as you want both famous and non-famous images in the training set.
Q3: Suppose you are developing an anomaly detection system to catch manufacturing defects in airplane engines You model uses
$$p(x) = \Pi^n_{j=1}p(x_j; \mu_j, \sigma_j^2)$$
You have two features $x_1$ = vibration intensity and $x_2$ = heat generated Both $x_1$ and $x_2$ take on values between 0 and 1 (and are strictly greater than 0), and for most normal engines you expect that:
$x_1 \approx x_2$. One of the suspected anomalies is that a flawed engine may vibrate very intensely even without generating much heat (large $x_1$ small $x_2$) even though the particular values of $x_1$ and $x_2$ may not fall outside their typical ranges of values What additional feature $x_3$, should you create to capture these types of anomalies:
- [x] $x_3 = \frac{x_1}{x_2}$
- [ ] $$x_3 = x_1 + x_2$$
Q4: Which of the following are true? Check all that apply.
- [ ] If you are developing an anomaly detection system, there is no way to make use of labelled data to improve your system.
- [x] When choosing features for an anomaly detection system, it is a good idea to look for features that take on unusually large or small values for {mainly the] anomalous examples. (These are good features, as they will lie outside the learned model, so you will have small values for p(x) with these examples.)
- [ ] If you have a large labelled training set with many positive examples and many negative examples, the anomaly detection algorithm will likely perform just as well as a supervised learning algorithm such as an SVM.
- [x] If you do not have any labelled data {or if all your data has label y = 0), then is is still possible to learn but it may be harder to evaluate the system or choose a good value of $\varepsilon$. (Only negative examples are used in training, but it is good to have some labelled data of both types for cross-validation.)
Q5: You have a 1-D dataset ${x^{(1)}, …, x^{(m)}}$ and you want to detect outliers in the dataset. You first plot the dataset and it looks like this:

Suppose you fit the gaussian distribution parameters $\mu_1$ and $\sigma_1^2$ to this dataset. Which of the following values for $\mu_1$ and $\sigma_1^2$ might you get?
- [x] $$\mu_1 = -3, \sigma_1^2 = 4$$
This is correct, as the data are centred around -3 and tail most of the points lie in [-5, -1].
Reference
[1] Andrew NG, Machine learning
[2] Chandola, V., Banerjee, A. and Kumar, V., 2009. Anomaly detection: A survey. ACM computing surveys (CSUR), 41(3), pp.1-58.
[3] Chalapathy, R. and Chawla, S., 2019. Deep learning for anomaly detection: A survey. arXiv preprint arXiv:1901.03407.
本博客所有文章除特别声明外,均采用 CC BY-SA 4.0 协议 ,转载请注明出处!